Independent Investor: Myths of the Market
 |
This year, I admit to paying rapt attention to one of the more popular seasonal indicators: January's "first five days."
The legend states that whatever direction the market takes in the year's first week so goes the market. Evidence indicates that this is not a very reliable indicator and yet I fell for it and have been bearish ever since. Statistically, it works best when the market is up on the first five days of any year.
"Sell in May and Go Away," is one often quoted saying that implies stock market returns are higher in the November-April period than in the May-October months. After 27 years experience in global markets, I tend to agree. My belief is backed up by multiple studies that indicate that in 36 out of 37 developed and emerging markets this indicator works the majority of the time.
 Although no one can provide one single cause for this, I believe it has something to do with summer vacations, especially in Europe where the effect has been noticeable since 1694.
Investors are also wary of the "October Effect" since throughout history the month has not been kind to capitalists - starting as far back as 1917, when the Russian Bolsheviks ushered in the era of Communism. October also witnessed the onset in 1929 of the Great Depression, when U.S. markets lost 30 percent of their value in three days.
In October 1987, I lived through the Black Monday Crash, experienced the Asian Currency Crisis of October 1997 from abroad and a year later (again in that dubious month) I was back in Manhattan for the Russian Loan Crisis which erupted at the same time as the near-collapse of the Connecticut hedge fund, Long Term Capital. Since then there have been several more mishaps including last year's 10 percent correction.
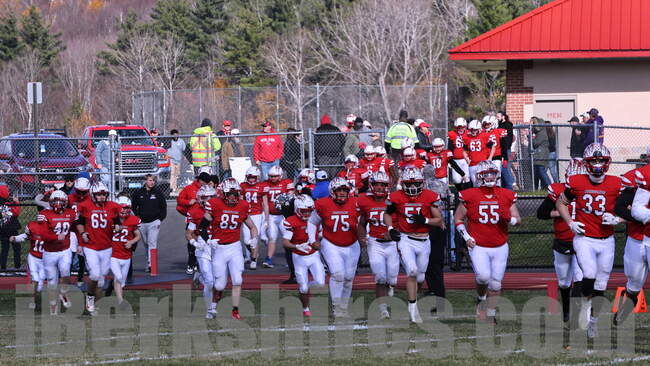
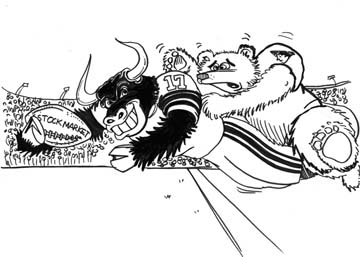
In the sports area, there is the Super Bowl Indicator, which has correctly indicated the direction of the stock market 76 percent of the time. A win by an old National Football League team means an up market for the year while a win by an AFL team indicates a losing year for the markets.
This year, the 17-14 upset victory by the New York Giants (NFL) over the New England Patriots (AFL) should indicate an up year. In addition to football, we also have horse racing and baseball indicators. A Triple Crown winner in racing will be bad news for the averages, and expect down markets whenever the New York Mets are in the World Series.
 The presidential election cycle theory holds that the first two years after an election are down or at least unstable while the last two are up years for the market. This theory hasn't held water in recent years.
 During George H.W. Bush's first year in office the market gained 25 percent while in both terms of Bill Clinton's presidency stocks were up 19.9 percent and 35.9 percent in his first years.
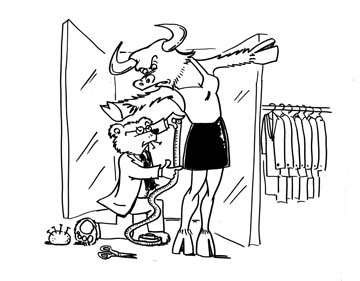
Other more chauvinistic indicators include: rising hemline fashions (indicating more confidence and excitement in the economy) equal up markets while an increase in lipstick purchases mean the opposite. Women, according to legend, tend to penny pinch in tough times and buy cheaper personal items like lipstick. If you believe that, I've got a bridge to sell you.
Like myths everywhere, Wall Street's indicators are more amusing than factual but when the markets are volatile and the future is unknown, what's the harm in a little card reading?
Bill Schmick is a licensed investment adviser representative and portfolio strategist with Berkshire-based Dion Money Management, managing more than $800 million for middle-class Americans from coast to coast. Direct your inquiries to Bill at 1-877-850-7942, Ext. 146, (toll free) or e-mail him at wschmick@dionmm.com. You can also visit www.afewdollarsmore.com for more of Bill's insight.